
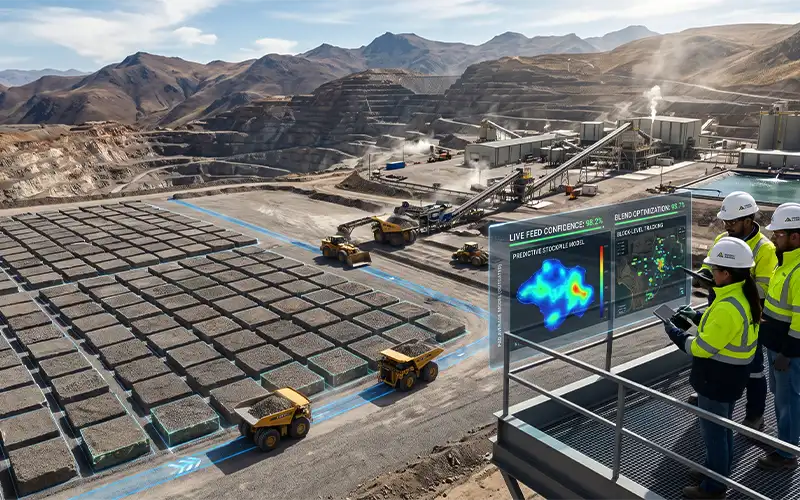
Building Confidence at Cerro Corona
Long-term stockpile modelling at Gold Fields Peru. Block-level tracking of the ROM pad replaced pad averages, giving metallurgists confidence in every feed decision.
Read the case studyUntracked ore variability quietly costs operations up to $2M a year. See exactly where it's going — and what fixing it is worth.
Trusted by operating gold, copper & nickel operations worldwide
We'll email the full case study and ROI breakdown to within one business day.
Calculate your own ROIThree steps stand between you and the variability you can't currently see.
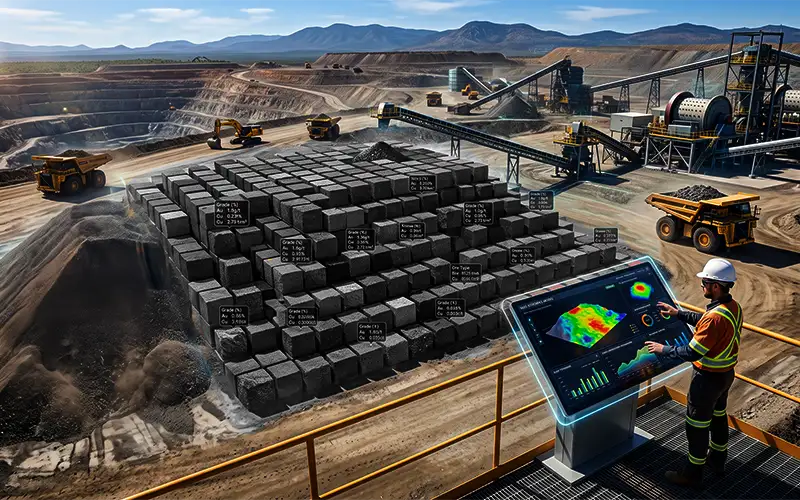 01
01Block-level stockpile modelling replaces crude pad averages — so you know the true grade, tonnage, and blend of what you actually have, not a blunt guess.
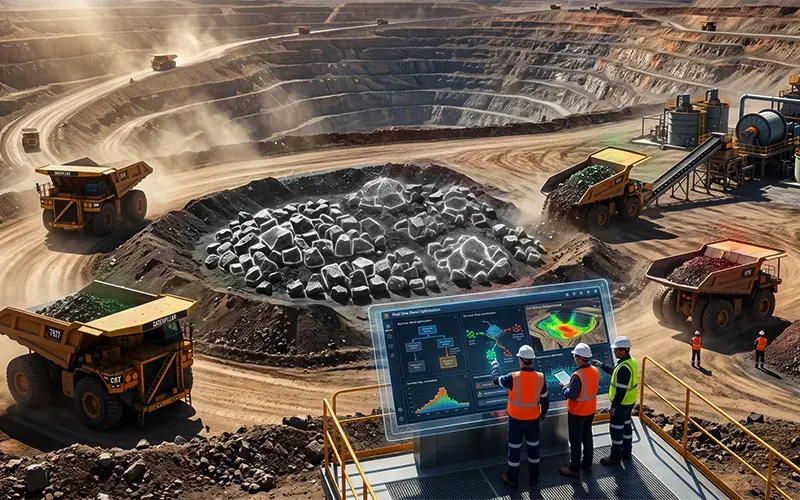 02
02Continuous tracking of grade, hardness, and penalty elements (As, S, Hg, clay) flags problematic ore before it contaminates a blend or deranges the circuit.
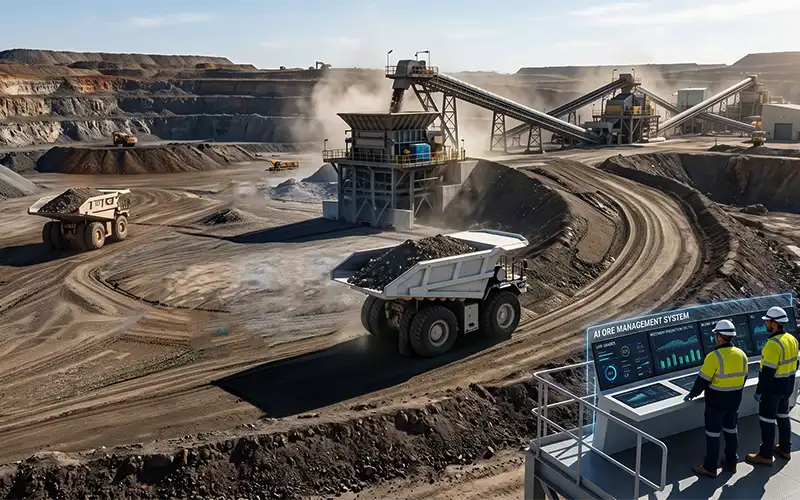 03
03The platform recommends re-handling, blending, and routing decisions in time to act — before ore reaches the crusher, not after the damage shows up in the mill.
The same variability you're carrying today was costing these sites — until it was measured and managed.
Long-term stockpile modelling at Gold Fields Peru. Block-level tracking of the ROM pad replaced pad averages, giving metallurgists confidence in every feed decision.
Read the case study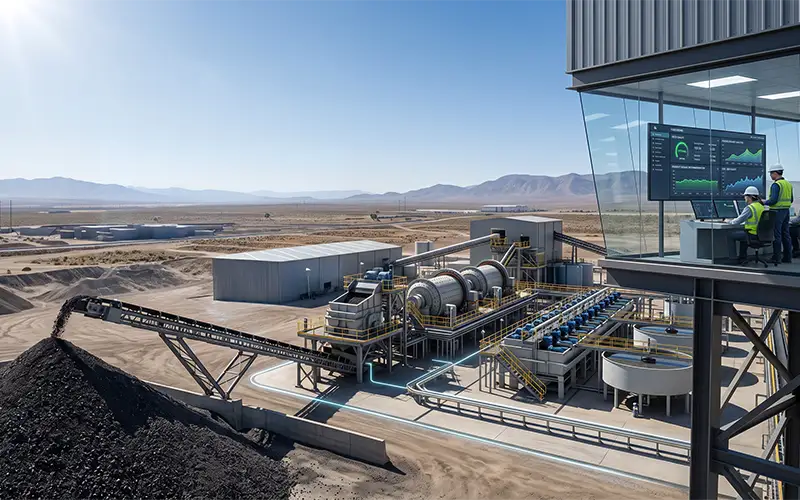
ROM Pad and feed forecasting to improve reagent dosage and recovery. Knowing what's actually in the feed — before it arrives — lets the circuit hold a consistent set point.
Read the report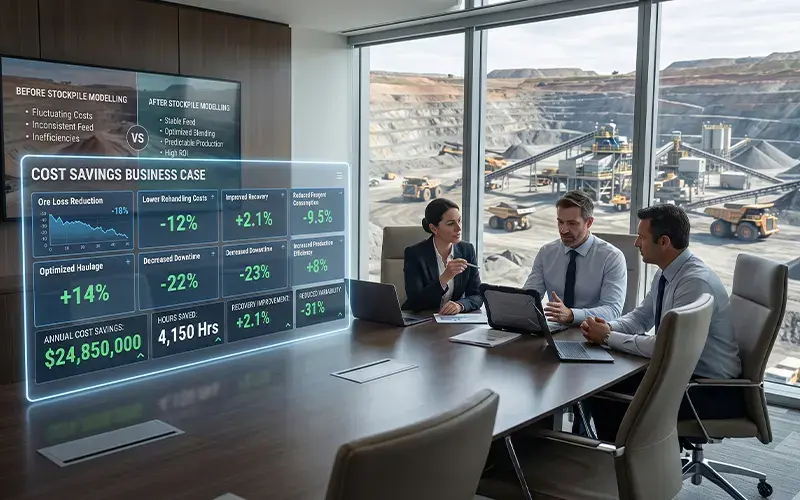
Dollars and hours saved annually through stockpile modelling. A documented business case showing where the money goes today — and what's recoverable when variability is managed.
See the business caseMost sites recover their investment inside a few months. Drag the slider to see your estimated savings and payback.
Estimates are illustrative, based on the case-study benchmarks cited above and industry recovery-uplift ranges. Actual results depend on ore mineralogy, circuit configuration, and data quality.
Almost always — and the payback math is straightforward. One avoided misdump event or a single quarter of recovered ore typically exceeds the entire annual software cost. Most sites recover their investment inside a few months, not years. Use the calculator above to see your own payback period.
Most operations are live in 4–8 weeks. We ingest your existing assay, dispatch, and stockpile data — no new sensors required to start, though integrating real-time sensors accelerates the value curve.
No. NTWIST sits alongside your existing stack (Datamine, Surpac, Mira, etc.) and consumes the data they already produce. It adds the stockpile-level variability layer those systems were never built to model.
The block-level modelling approach is commodity-agnostic — we have deployments across gold, nickel (HPAL), copper, and polymetallic circuits. Penalty-element and hardness tracking adapt to whatever your circuit is sensitive to.
Get the full case study and the ROI math for your site — your numbers, not a benchmark.